U.S. credit unions, and other financial institutions, experienced a liquidity crunch in 2023 unlike anything seen in recent years. Aggregate deposit growth for the credit union industry in 2023 was less than 2%, the lowest since before 1982.
In the first quarter of 2024, aggregate deposit growth for the industry was nearly 11% on an annualized basis. Reviewing deposit growth for a sample of Rochdale’s clients, the 2024 Q1 annualized pace was just over 13%, vs. less than 1.8% for the same group of clients in 2023. It appears that the liquidity crunch is over (the usual anomalous tax-related April blip notwithstanding). The key questions are where did the increase in liquidity come from, and how likely is it that it will be sustained?
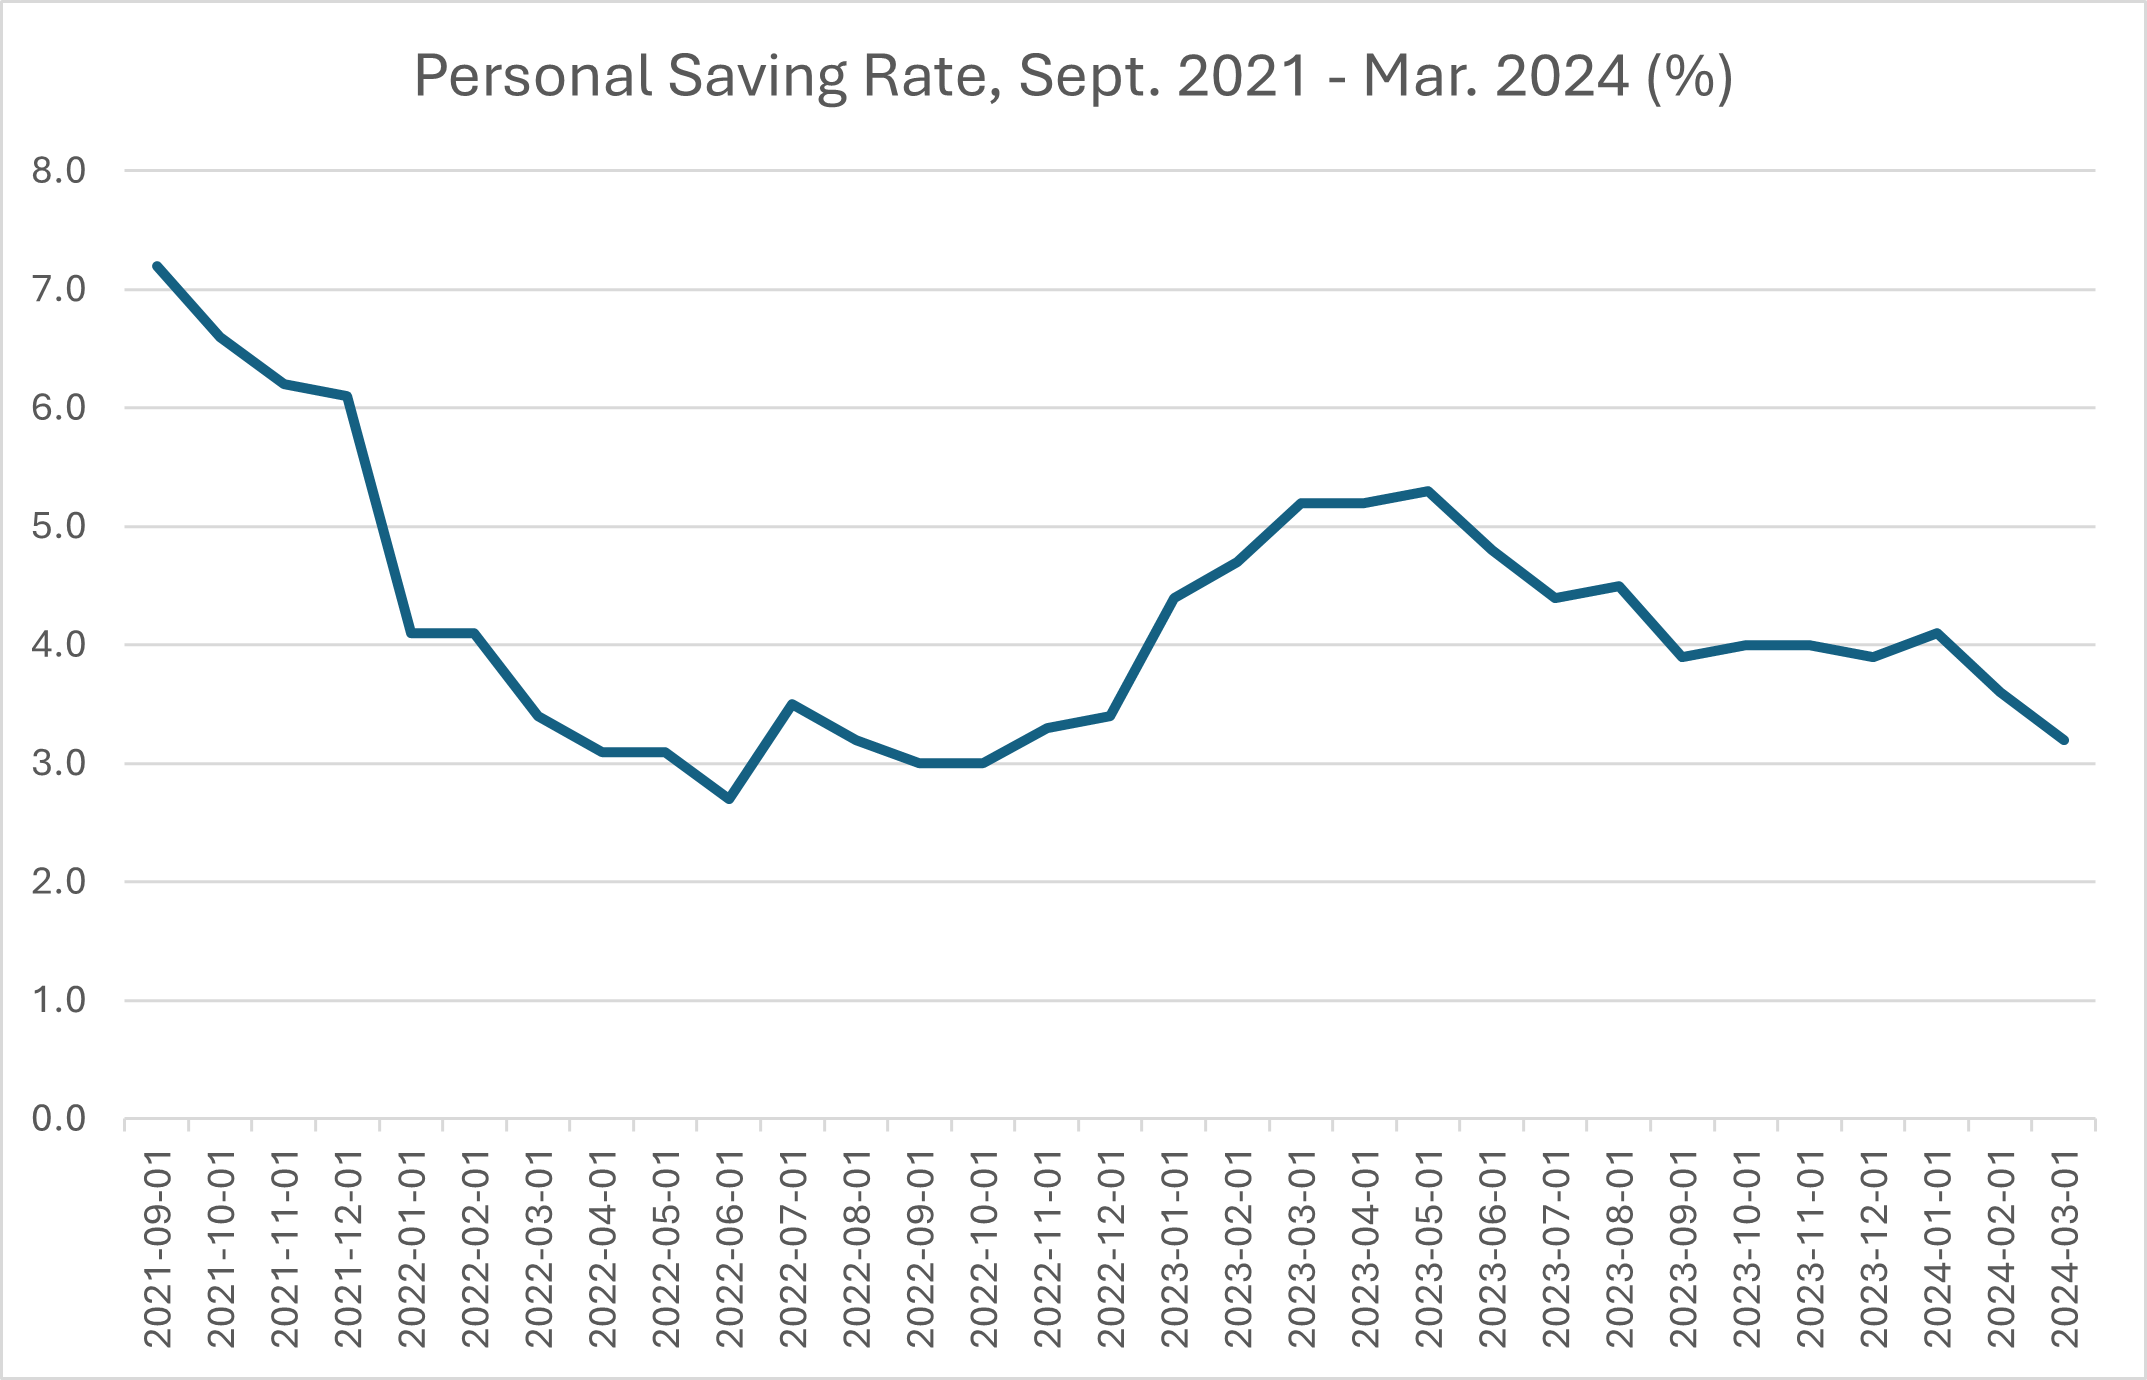
The most obvious place to look is the Personal Saving Rate, which is the ratio of savings to disposable income. The saving rate peaked at a record 32.0% in April 2020, when COVID stimulus payments led to massive deposit inflows for financial institutions, as the economy was shut down and the money couldn’t be immediately spent. However, the saving rate has declined steadily from May 2023 through March 2024, from 5.3% to 3.2%. Note from Figure 1 below that the saving rate actually increased for the first five months of 2023, when credit union liquidity was contracting. Clearly, such small fluctuations in the saving rate weren’t the driving force behind the significant liquidity squeeze the industry experienced last year.
Figure 1: Personal Saving Rate

(Source: St. Louis Fed FRED database; U.S. Bureau of Economic Analysis)
Since the saving rate is defined as savings as a percent of disposable income, one could theorize that the increase in liquidity could have resulted from an increase in disposable income; the idea being that, all else being equal, even a declining percentage of an increasing amount of income being saved could produce increased deposit flows. However, disposable income year-over-year grew at a decreasing rate from the beginning of 2023, when it was nearly 9.0%, to March 2024, when it reached just 4.1% – the same pace as in September 2022. Real disposable personal income was even lower in March 2024, due to the effect of compound inflation.
This begs the question: to what can we attribute the increase in liquidity in the first quarter of 2024?
The answer may lie in broader measures of money in the financial system. Since the Fed began raising rates to combat inflation, it has also been engaged in Quantitative Tightening – selling government bonds to reduce the size of its balance sheet, which has the effect of increasing interest rates. (Selling large quantities of bonds results in lower prices of bonds in the market, and since bond prices and yields move in opposite directions, those lower prices result in higher market interest rates.)
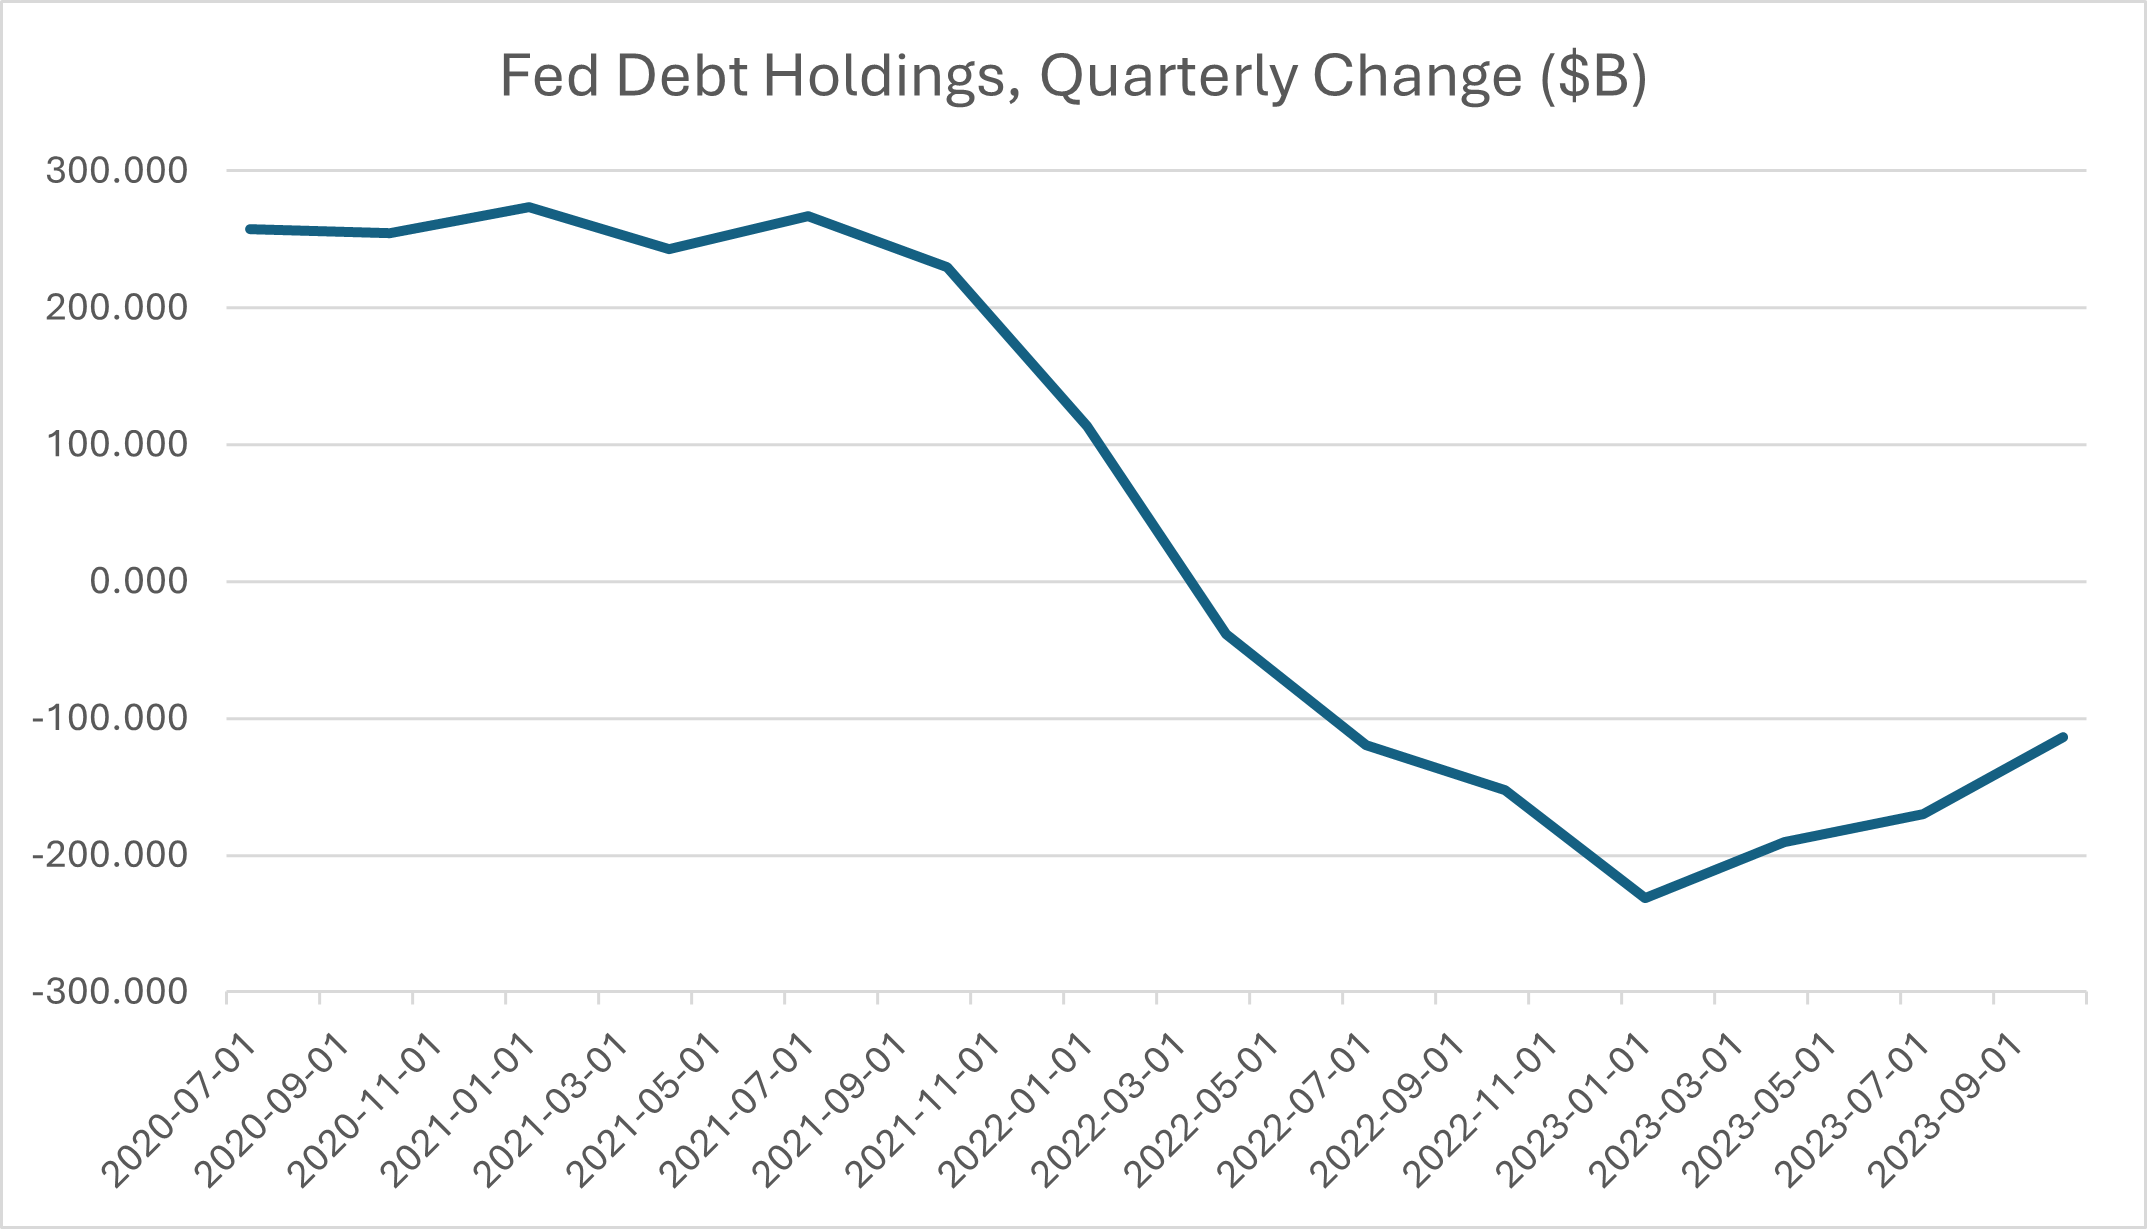
From 2021 Q3 through 2023 Q1, the quarterly change in the Fed’s holdings of government bonds declined from $267B to -$231B (see Figure 2 below). This effectively withdrew nearly $200B in liquidity from the financial system. However, beginning in 2023 Q1, the pace of Quantitative Tightening (QT) slowed, as the Fed began to “taper” its QT program in response to a decline in the rate of inflation. As of 2023 Q4, the decline in the Fed’s government debt holdings was $113B, about half the rate of the beginning of 2023.
Figure 2: Quarterly Change in Fed Holdings of Government Debt

(Source: St. Louis Fed FRED database; U.S. Dept. of the Treasury)
What was the effect of the Fed’s shift in policy on the money supply? To answer this question, let’s turn to the broadest measure of the money supply, M1, which consists of currency, demand deposits, and other liquid deposits.
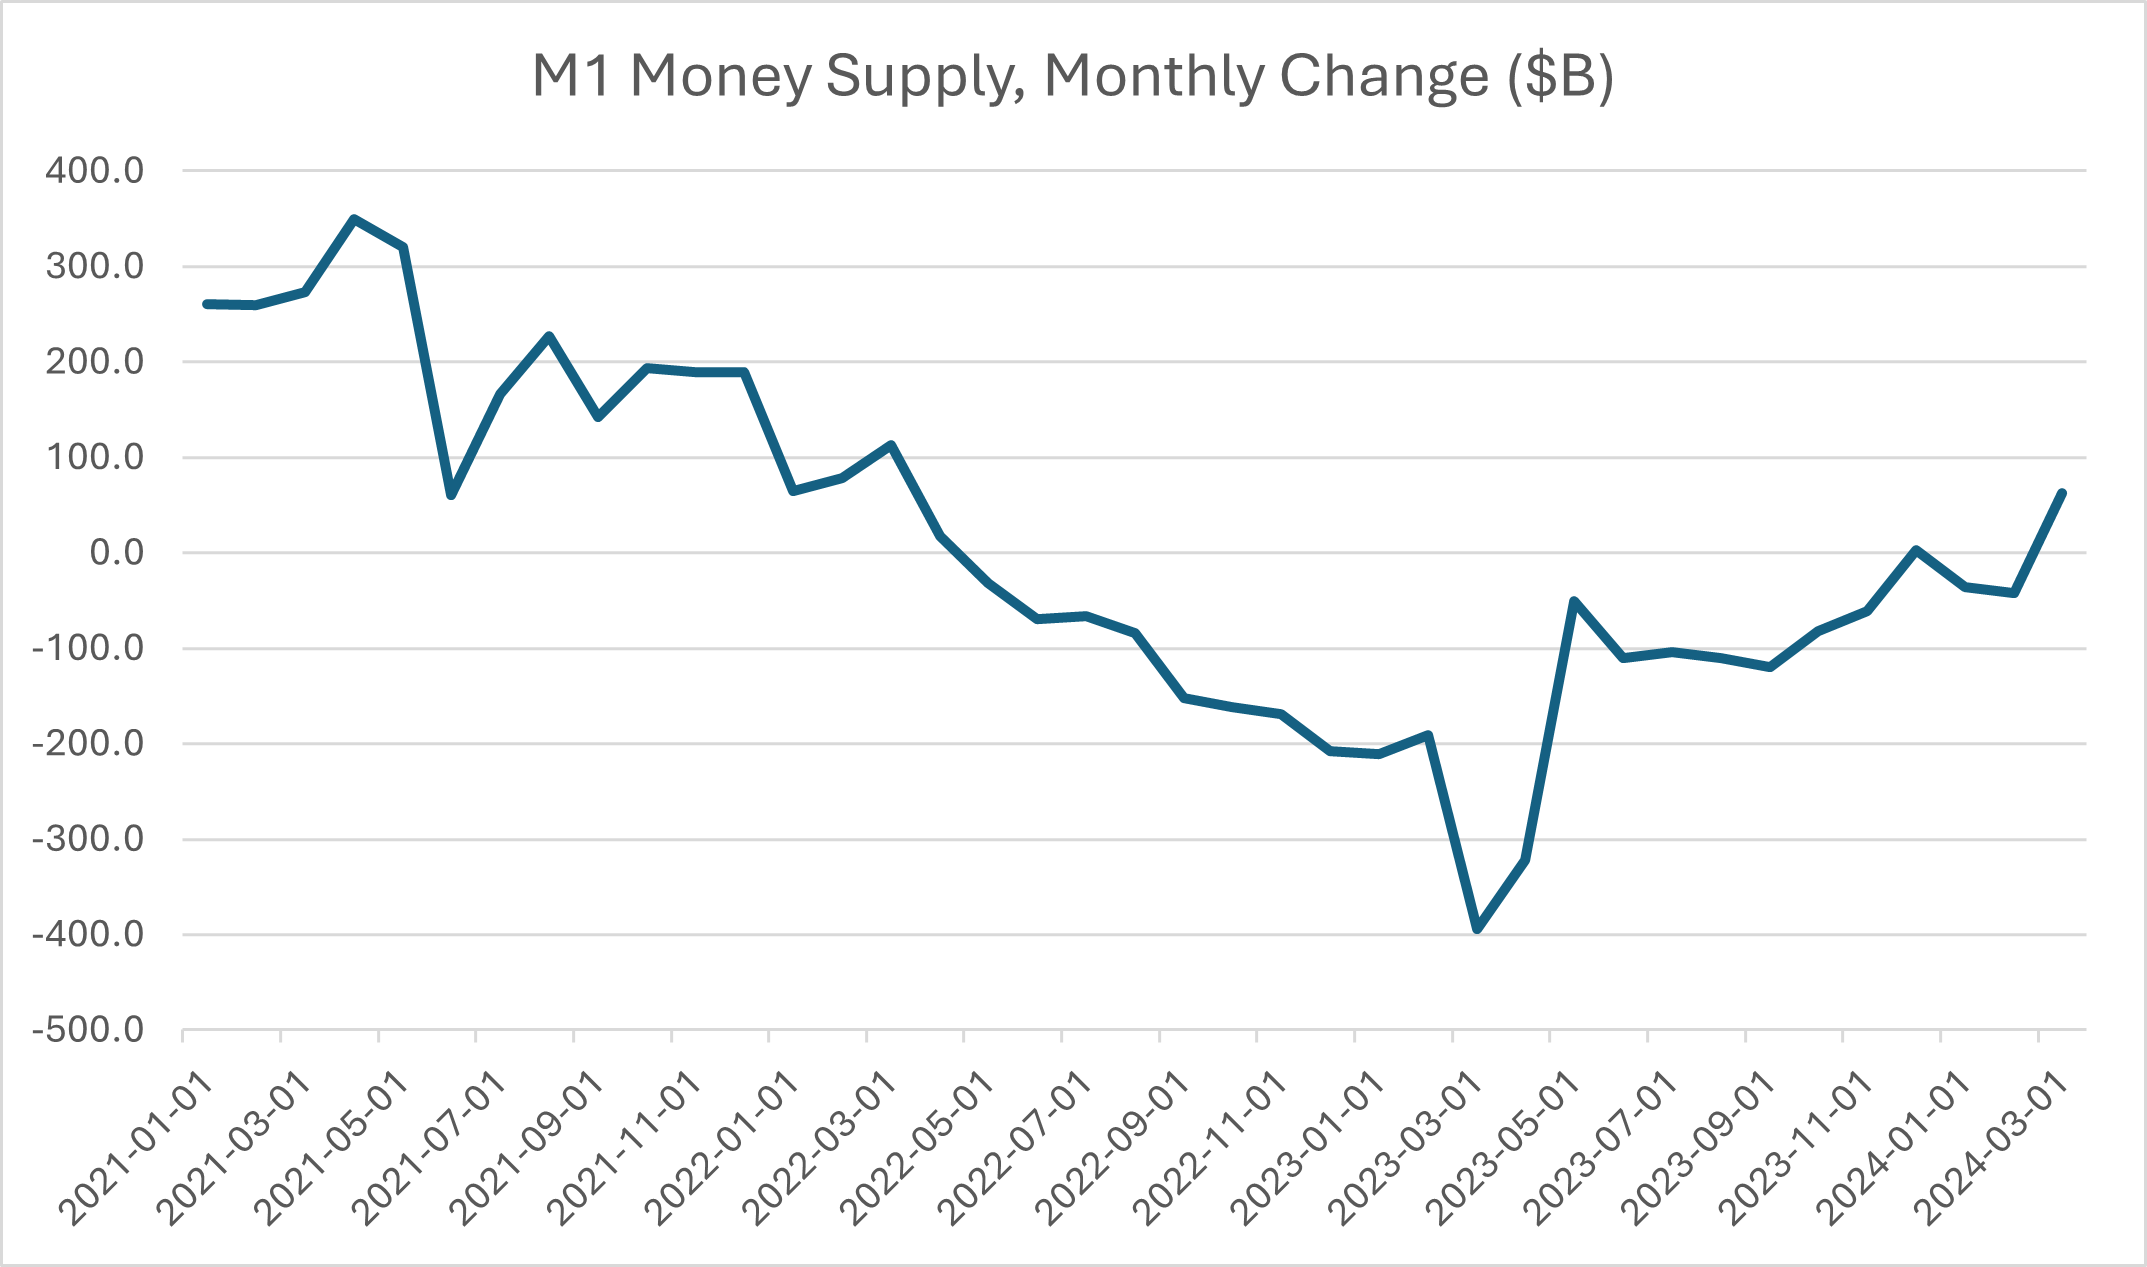
The monthly change in M1 declined from $350B in April 2021 to -$394B in March 2023. That monthly change quickly reversed, declining to less than -$51B by May 2023, and in March 2024, the monthly change turned positive, with M1 increasing by more than $62B (see Figure 3).
Figure 3: Monthly Change in M1

(Source: St. Louis Fed FRED database; Federal Reserve)
One might ask why it’s taken until the first quarter of 2024 for this increase in the broader money aggregates to show up in financial institution liquidity. The answer probably lies in the velocity of money, which likely explains the approximately one-year lag between increases (or the declines in the pace of decreases) in the broader monetary aggregates and financial institution liquidity.
In general, the velocity of money is the rate at which consumers and businesses exchange money. It can be viewed as the number of times that that money moves from one participant in the economy to another, or how much a unit of currency is used in a given time period. The velocity of M1 contracted sharply from 2019 Q3 to 2020 Q3 due to the economic shutdown in response to the COVID pandemic. After that, it was essentially flat until mid-2022, after which it began to accelerate, albeit modestly, through the first quarter of 2024. However, even modest increases in velocity can have a powerful effect on liquidity, especially if the broader aggregates are increasing (or contracting at a decreasing rate).
The Bottom Line
The bottom line is that the sudden resurgence of liquidity in the first quarter of 2024 may have less to do with consumers’ response to concerns over a slowing economy and increasing credit issues, as many observers believe is the driving force behind it, than with Fed policy and changes in the money stock and the velocity of money. So what does this portend for the remainder of 2024?
At its May 2024 meeting, the FOMC announced that it would further curtail its sales of government bonds, so we should see continued declines in bond sales, resulting in a diminished downward effect on bond prices. This, in turn, should lead to a continued increase in the money supply. As demand remains extant, velocity should continue to increase as well, leading to further easing of liquidity constraints. Thus it appears that the liquidity crunch of 2023 is behind us, and that credit unions should see positive deposit growth trends throughout 2024.
